
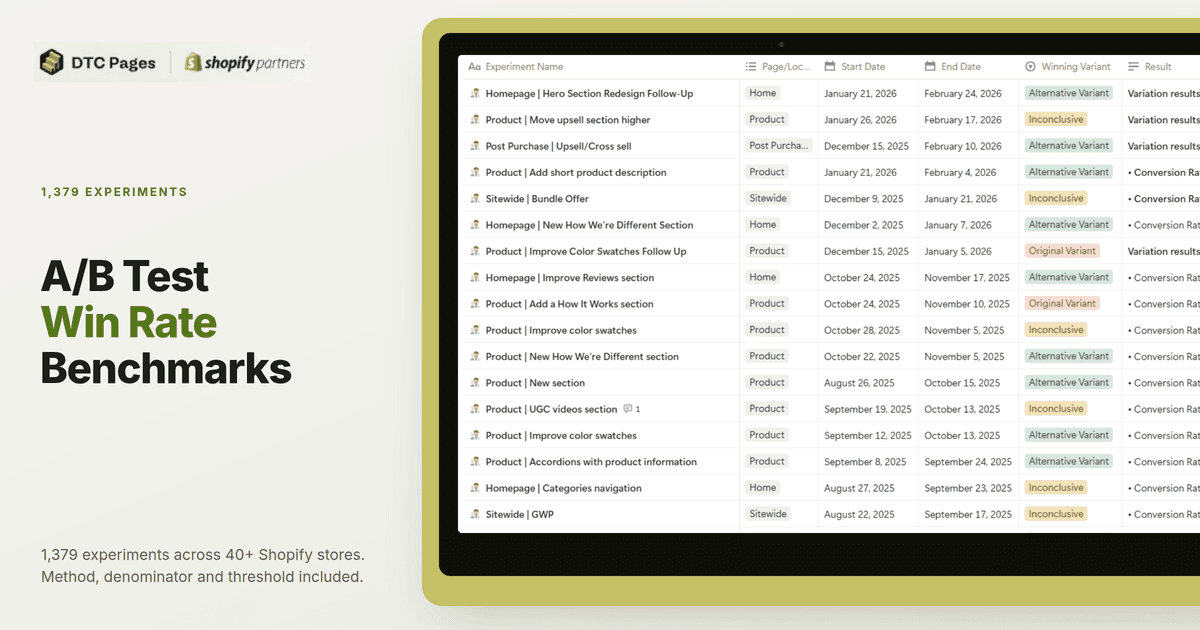
An A/B test win rate is the share of experiments where the variant beat the control at a confidence threshold you set in advance. Across 1,379 experiments DTC Pages ran on more than 40 Shopify stores between 2021 and 2026, calling winners at 90% probability of beating the control, 37.9% won. Another 38.5% never resolved either way.
The win rates everyone quotes are not comparable#
The first thing to say is that there's no consensus when we talk about an average win rate in CRO. Many sources claim different numbers, and they vary depending on who conducts the experiments, the criteria used to consider an experiment a winner, and the niche or industry.
For example, CXL mentions that around 20% of A/B tests reach 95% significance at all, winners and losers together. ConversionTeam mentions that almost 50% of their e-commerce tests produce a winner, but that around 17% achieve statistical significance. This comes from the same sample of 1,216 tests. We at DTC Pages specialize in e-commerce, and we can discuss the results of the CRO work we have done over the years for more than 40 brands across many different niches and industries.
We consider a winner when our experiments reach a 90% probability of beating the control for the KPI we are looking to improve.
Key numbers at a glance#
What was the result of a sample of 1,379 tests at a 90% confidence threshold? 37.9%.
| Experiments with a verdict | 1,379 |
| Alternative variant won | 523 (37.9%) |
| Inconclusive | 531 (38.5%) |
| Control won | 325 (23.6%) |
| Wins to losses | 1.61 to 1 |
| Period | 2021 to 2026 |
| Brands | over 40 Shopify stores |
38.5% of the experiments were neither a winner nor a loser according to our 90% threshold. We treat inconclusive results differently depending on the trend, but we always consider an experiment below 90% to be inconclusive, regardless of what we do with the experiment in the end. Sometimes, we consider that the benefits outweigh a possible negative impact, discuss it with the client, and deploy anyway.
How we counted this#
Our core is A/B testing. We always aim to run one with our clients when we make changes, so the decision rests on verified data. Those are the only ones that count toward these statistics. Any other changes, such as tickets, direct implementations, ideas, or roadmap entries, are excluded. That's why the number is 1,379.
Following our criteria, a variant wins when it has a 90% probability of beating the control on any of four KPIs: conversion rate, average order value, revenue per visitor and profit per visitor. The four are fixed before the test runs, and the same four decide a loss. Some tests add one metric specific to their hypothesis, such as subscription rate, also declared before launch. The control wins when the opposite happens. Anything in between is considered inconclusive.
The threshold is symmetric, and we are simply stating it rather than defending it. We use 90% because a 95% cut files too many real winners as inconclusive. We would rather occasionally ship a change that turns out to do nothing than repeatedly discard one that was working. For reference, DRIP Agency reports 36.3% on European e-commerce brands at a 95% threshold, close to our 37.9% at 90%, though the two are measured on different instruments.
All of our verdicts are recorded, and we have the results for each of them, along with the tool report link for every experiment, mainly from Google Optimize, Convert, and Intelligems.
Win rate by page location#
| Location | Win rate | Wins to losses | N |
|---|---|---|---|
| Checkout | 46.1% | 1.94 | 76 |
| Landing | 40.1% | 2.12 | 137 |
| Product | 38.4% | 1.86 | 489 |
| Cart | 37.3% | 1.30 | 150 |
| Collection | 35.9% | 1.31 | 128 |
| Navigation | 32.1% | 1.00 | 81 |
| Home | 31.8% | 1.31 | 173 |
Sitewide, kept separate because it is a scope and not a page: 75 tests, 38.7%, 1.81 to 1.
In our insight research, we also broke the results out by page in order to know which locations were producing most of our winners. The results are not exactly surprising, but they do follow a consistent pattern.
First of all, the number of experiments is not evenly distributed. Some locations have many more experiments than others. For example, the win rate on the checkout shouldn't carry as much weight as the win rate on the product page: the checkout has only 76 tests at 46.1%, while the product page has almost 500 at 38.4%. Some results should be read as directional rather than as a benchmark.
Put a margin on it and the point gets sharper. Product carries a margin of roughly four points, so its 38.4% is a real estimate. Checkout carries a margin near eleven points, which means its 46.1% overlaps the overall average. We are publishing it anyway, with the margin, because a table that only shows the confident cells is not a benchmark.
Navigation is the row that stopped us. Twenty-six wins and twenty-six losses, exactly even against doing nothing. It is not that navigation tests fail. It is that they succeed as often as they backfire, which for planning purposes is worse than failing.
Home sits at the bottom at 31.8%, and it is the highest traffic page on almost every store we work on. Those two facts together are the most expensive thing in this table.
The seven buckets cover 1,234 tests, or 1,309 with sitewide included, which is 94.9% of the dataset.
Win rate by vertical#
Three verticals in our book have enough tests and enough separate brands to report. The others do not.
| Vertical | Win rate | Wins to losses | N |
|---|---|---|---|
| Apparel and accessories | 42.2% | 1.39 | 277 |
| Supplements and health | 39.4% | 1.65 | 497 |
| Home and goods | 33.3% | 1.85 | 267 |
Apparel and accessories is the only vertical clearly above the overall 37.9%. The likely reason is unglamorous: clothing and accessory stores put more decisions on the page, sizing, colour, fit, bundles, so there is simply more to move.
Home and goods is the interesting row. It has the lowest win rate and the best wins to losses ratio in the table, which sounds contradictory until you look at what those tests do. Fewer of them win, but far fewer of them break anything. If your category looks like this, your programme is not underperforming. It is running on a surface where most changes are neutral.
What separates the programmes that win more#
A 38% win rate means the default outcome of any given experiment is not a win. Programmes budgeted on the assumption that most tests work are mispriced from the first month, and that mispricing usually shows up as pressure to call tests early.
The real cost is not the 23.6% where the control wins. It is the 38.5% that never resolve. A loss teaches you something. An inconclusive consumes the same traffic, the same build time and the same two weeks, and gives you nothing you can act on.
In our experience the programmes that pull ahead are not the ones with better hypotheses. They are the ones willing to test removing things.
From our own record. A supplements brand we manage ran a social proof widget, the kind that announces that someone in Ohio just bought this. Before touching it we pulled its own numbers: it had been shown 4.76 million times, clicked 8,550 times, a click through rate of 0.18%, and produced 1,098 attributed transactions. Eighty seven percent of the people who engaged with it did not buy. Meanwhile it was covering part of the screen on mobile, where most of the traffic was. We tested removing it. Conversion rate rose 1.76% at 95% confidence, consistent across new and returning visitors, which on that store projects to 1,049 additional orders a month.
Nobody finds that by reading a list of best practices, because a best practices list is what put the widget on the store in the first place. We took the same approach to a hydration brand's product page, going through it section by section on mobile, in a public teardown of Reboot Hydration.
How to compare your own programme#
Before you measure anything, write down two things: what counts as a win for you, and at what threshold. Most teams cannot answer the second question, and until they can, every comparison they make against a published benchmark is arithmetic on incompatible units.
Then check three things against your own record. What share of your tests resolved at all, because that is the number most programmes have never looked at. Your wins against your losses, which is steadier than your win rate because moving the threshold moves both columns at once. And your win rate by page, because a programme that only tests the homepage will read as broken when it is only badly aimed.
Two comparisons to avoid. Do not put a 90% number next to a 95% number. And do not put a significance based rate next to a directional one. If you want to check where your own tests sit, our statistical significance calculator will tell you what your current sample can actually detect.
If your number comes out lower than ours, the first thing to check is not your hypotheses. It is your traffic. Half of a low win rate is usually an inconclusive rate hiding behind it, and that is a sample size problem wearing a strategy problem's clothes.
Frequently Asked Questions#
What is a good A/B test win rate?#
Around a third to 40% of tests winning is normal for e-commerce once you require statistical significance. Ours is 37.9% across 1,379 experiments at a 90% threshold. DRIP Agency, running on European e-commerce brands at a stricter 95% threshold, published 36.3%. Different thresholds, similar answer. Figures above 50% almost always come from a definition that does not require significance at all.
How many A/B tests actually win?#
In our record, 523 out of 1,379. Roughly one in three.
What percentage of A/B tests are inconclusive?#
38.5% of ours, which is more than the share that win. Most published benchmarks do not report this number at all, usually because their definition of a win does not require significance, so almost nothing is left over to be inconclusive.
Is a 38% win rate good?#
It sits right in the normal band for e-commerce, which is the point. A published win rate far above 40% usually means a loose definition of winning, a small sample, or both.
Why do so many A/B tests fail?#
Most do not fail. They fail to resolve. The change was too small to detect at the traffic available, so the test runs, ends, and tells you nothing either way.
Does the page you test on change your odds?#
Yes, and the spread across our seven page buckets is about fourteen points. Checkout and landing pages perform best in our record, navigation and the homepage worst. Navigation is exactly even, 26 wins against 26 losses.
What significance threshold should you use?#
Whatever you choose, apply it symmetrically and publish it. We use 90% in both directions. A threshold applied only to winners inflates your record, because losses then need a stronger signal than wins to be counted.
How is a win rate different from a conversion lift?#
The win rate is how often you win. The lift is how much you win by. A programme can have an excellent win rate made entirely of changes too small to matter.
Do win rates differ by industry?#
In our data, apparel and accessories sits about three points above supplements and nine above home goods. We would not extrapolate past that. The differences between verticals are smaller than the differences between individual stores.
Should you stop a test as soon as it hits significance?#
No. A probability that crosses a threshold on day four often crosses back. We hold tests to a fixed run of at least two full weeks so the result covers complete weekly cycles, and we look for the probability to hold and the confidence interval to narrow before calling anything.
Next Steps#
If you take one thing from this, make it the smallest one: write down your threshold and your denominator this week, before you run anything else. Most benchmarking arguments disappear the moment both sides can say what they were counting. Once you have that, our A/B testing service page covers how we run programmes on Shopify, and if you want us to look at where your own tests are landing, book a strategy call and bring your last twenty results.
Want us to run this for your store?
We help 7- to 9-figure Shopify brands increase revenue through data-driven CRO. Book a free strategy call.
Ready to grow your Shopify store?
We help 7- to 9-figure ecommerce brands increase revenue through A/B testing, landing pages, and conversion rate optimization. No contracts, just results.