
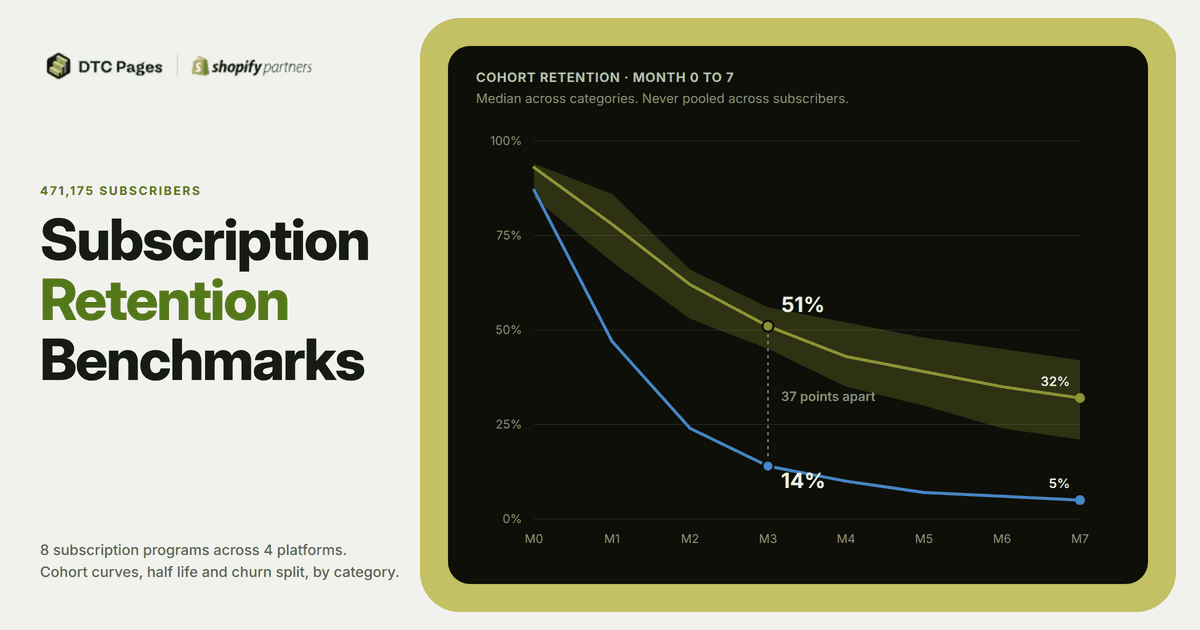
Subscription retention is the share of a signup cohort still subscribed after a given number of months. Across four consumable DTC subscription categories we measure, covering 438,961 subscribers, 51% were still active at month three. The one non consumable category in the same set was at 14%.
The benchmark everyone publishes averages two different businesses#
Subscription benchmark pages publish the same thing: one retention curve, one number per month, presented as what a DTC subscription looks like.
We have dashboard access to eight subscription programs across four platforms. We pulled their cohort curves and put them side by side. Four of them stayed within 2x of each other at every single month on the curve, tightest in the first month and widest by month seven.
A fifth sits 3.6x below the median of those four by month three. It carries tens of thousands of subscribers of its own, and its curve falls in order month after month, so this is not a small sample and it is not a broken report. It is a different kind of business, and every published benchmark averages it in with the other four.
The useful question is not "What's the average?" but "Which average does my store belong to?"
Key numbers at a glance#
Every figure below comes from a cohort curve or a twelve month window we pulled from the platform ourselves. None of it is survey data.
| Metric | Value |
|---|---|
| Month 3 retention, consumables | 45% to 56%, median 51% |
| Month 3 retention, non consumable | 14% |
| Month 6 retention, consumables | 24% to 45%, median 35% |
| Half life, consumables | 2.4 to 4.5 months |
| Half life, non consumable | 0.9 months |
| Voluntary share of churn | 84% to 94%, median 89%, 4 programs |
| Subscription AOV vs non subscription | 15% lower, median of the 4 where it is lower |
| Programs | 8 across 4 platforms |
| Subscribers in cohort curves | 471,175 |
8 DTC subscription programs measured by DTC Pages, 2026.
The two retention rows at month three are the post. Same month, same metric, 37 points apart.
How we collected this#
This comes from eight subscription programs DTC Pages has dashboard access to, across four platforms: Recharge, Skio, Stay AI and Loop.
Every figure uses the same window, 23 September 2025 to 22 September 2026. That sounds obvious and it is the step most comparisons skip. These dashboards all open on a thirty day view by default, and thirty days answers a different question than twelve months.
Cohort curves cover 471,175 subscribers. Month 0 is the month a subscriber signs up. That is worth stating because the platforms do not agree on it: Recharge calls it Month 0 and Skio calls the same thing 1st Month.
Programs are grouped and reported by category. No store is named, and no figure is published at a level that identifies one.
Every figure is a median across programs. We never weight by subscribers. One program in this set holds 67% of the subscribers, so a weighted average would be that one program wearing a disguise.
Consumable or not is the only split that holds#
Most benchmark pages segment by industry. We tried that first and it did not hold. Supplements and pet food landed closer to each other than two supplement brands would if one sold a monthly powder and the other sold a device.
The split that did hold is cruder. Does the product run out?
| Month | Consumables min | Consumables median | Consumables max | Spread | Non consumable |
|---|---|---|---|---|---|
| 0 | 85% | 93% | 94% | 1.11x | 87% |
| 1 | 68% | 78% | 86% | 1.26x | 47% |
| 2 | 53% | 62% | 66% | 1.25x | 24% |
| 3 | 45% | 51% | 56% | 1.24x | 14% |
| 4 | 35% | 43% | 52% | 1.49x | 10% |
| 5 | 30% | 39% | 48% | 1.60x | 7% |
| 6 | 24% | 35% | 45% | 1.88x | 6% |
| 7 | 21% | 32% | 42% | 2.00x | 5% |
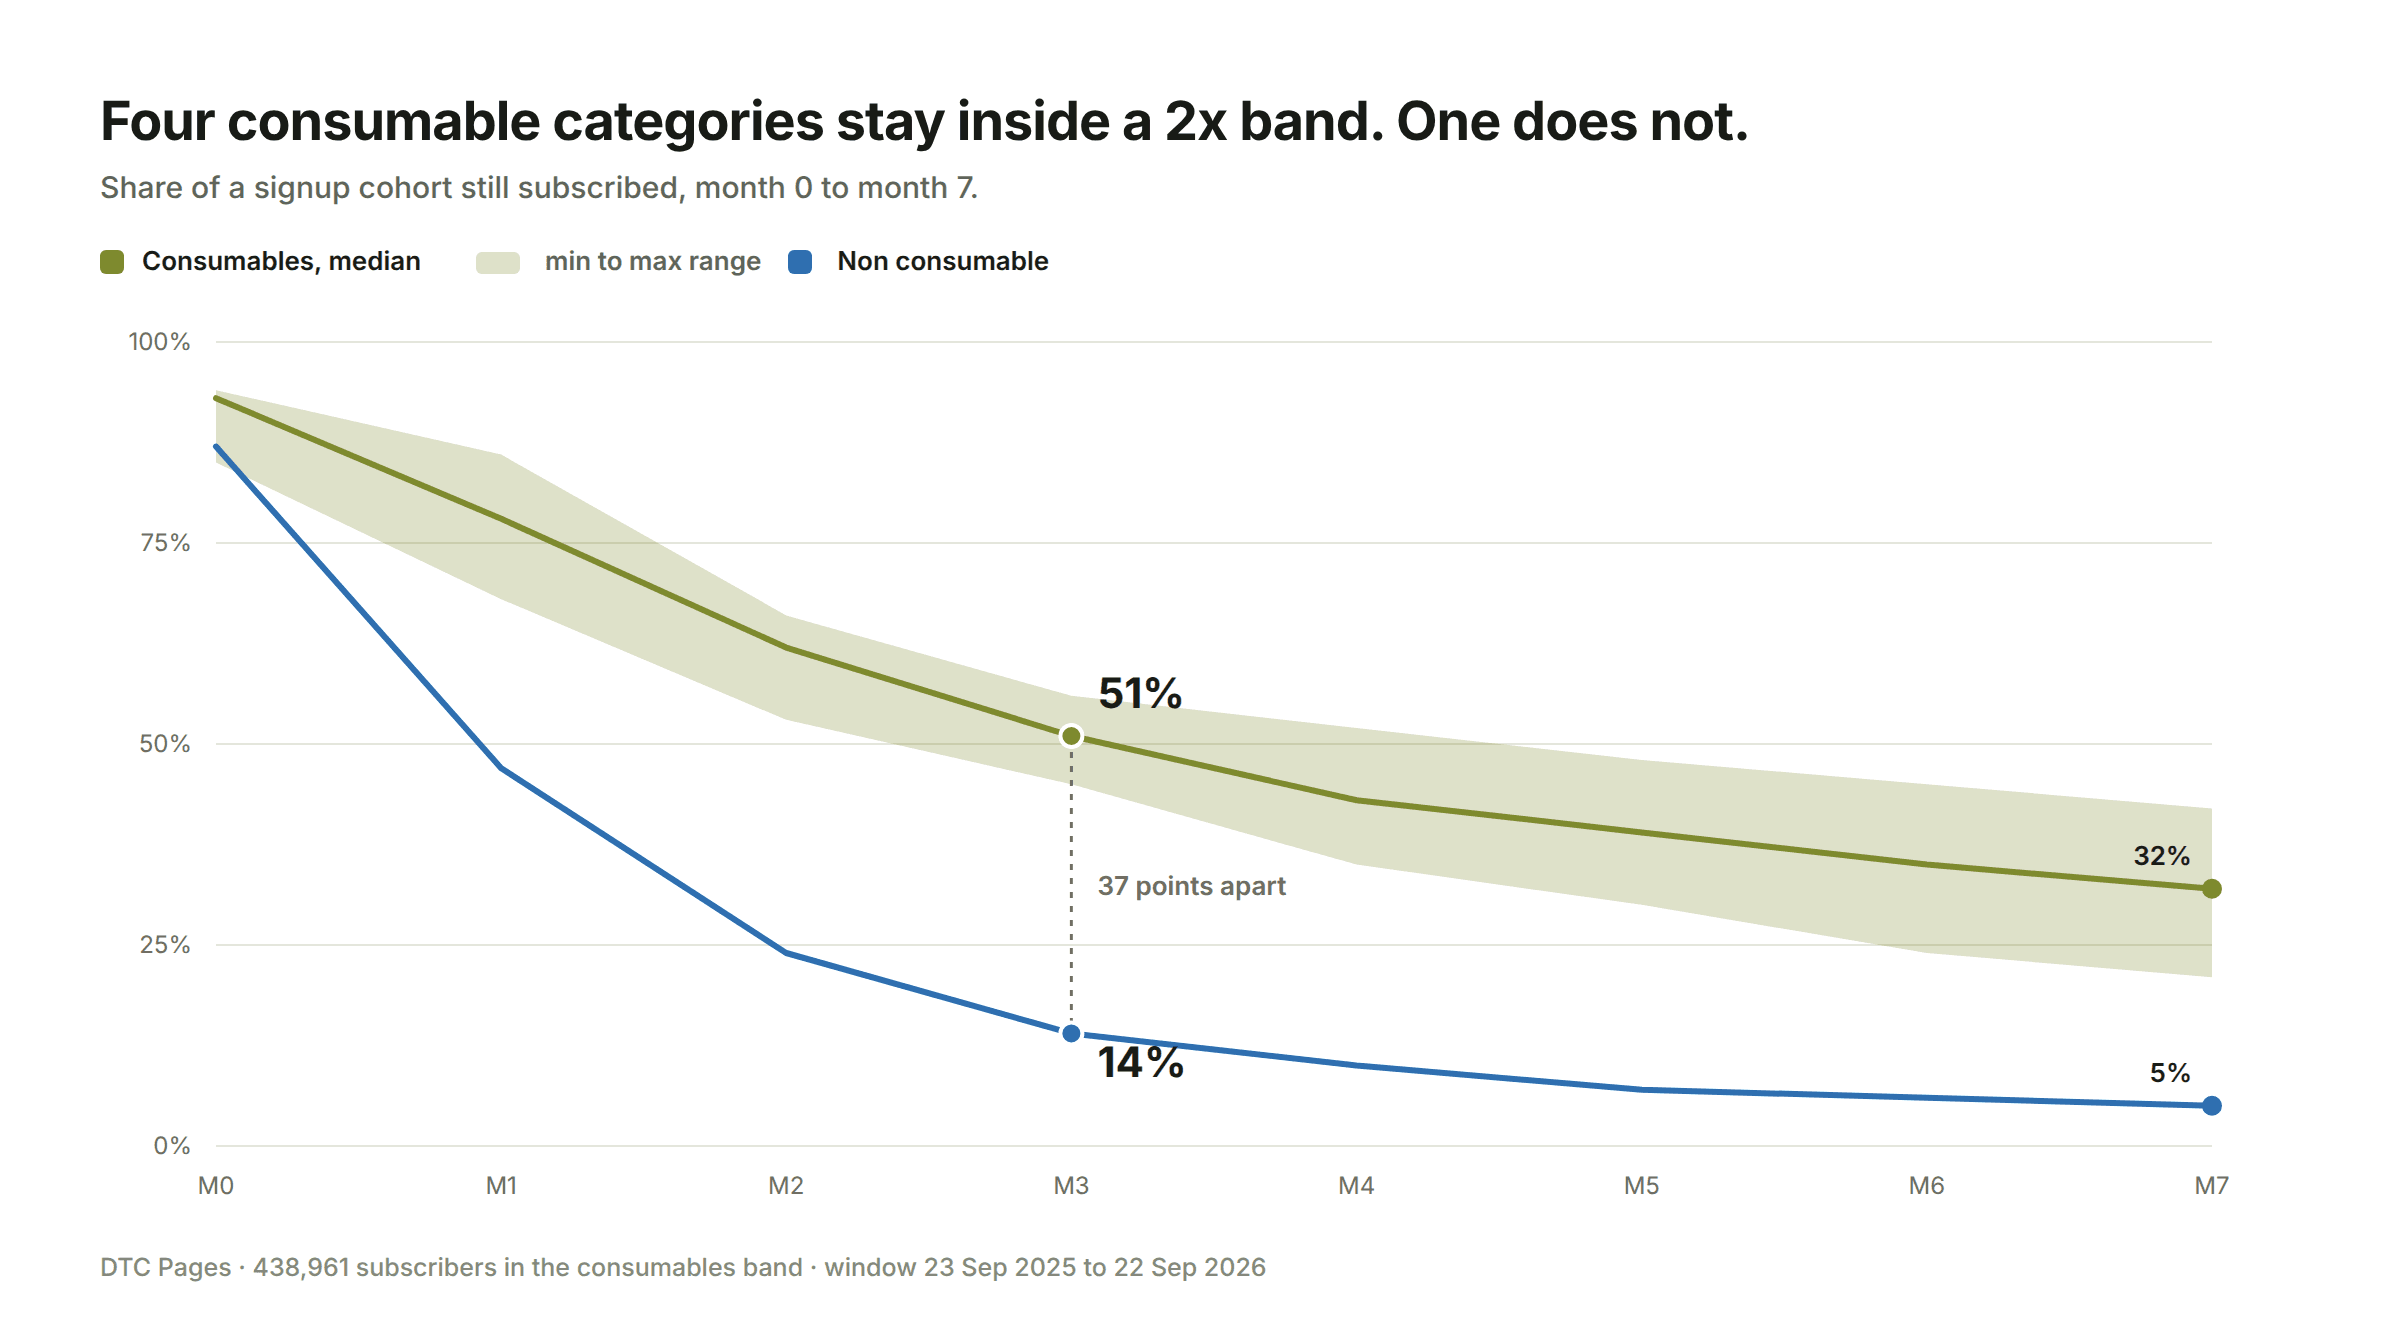
Base: four consumable categories, 438,961 subscribers. The right hand column is a single non consumable category, on a base of more than 30,000 subscribers. Measured by DTC Pages, 2026.
Four of these categories sell something that gets consumed. Across 438,961 subscribers they stay inside a 2x band at every month on the curve. For four independent businesses on three different platforms, that is closer than we expected.
The two best curves in the set both come from supplement brands. They are separate companies on separate platforms. That is the closest thing to a replication we have.
The fifth category sells something that does not get used up. It sits 3.6x below the median of the band at month three.
This is not a category doing subscription badly. The product lasts months. The rhythm at which someone actually needs another one is longer than the rhythm at which a subscription bills them, so people cancel and come back instead of staying subscribed. No amount of retention work moves that curve onto the consumables band.
What it does mean is that a published benchmark built from a mixed portfolio gives you a number that is wrong for both kinds of business at once. Too high if you sell durable goods. Too low if you sell consumables.
Consumable or not is the useful version of this split, and it is an approximation. The sharper question is how long one shipment lasts against how often you bill. A product that never runs out is just the extreme case of the same thing.
Half life: one number per program#
If you take one number from this post, take this one.
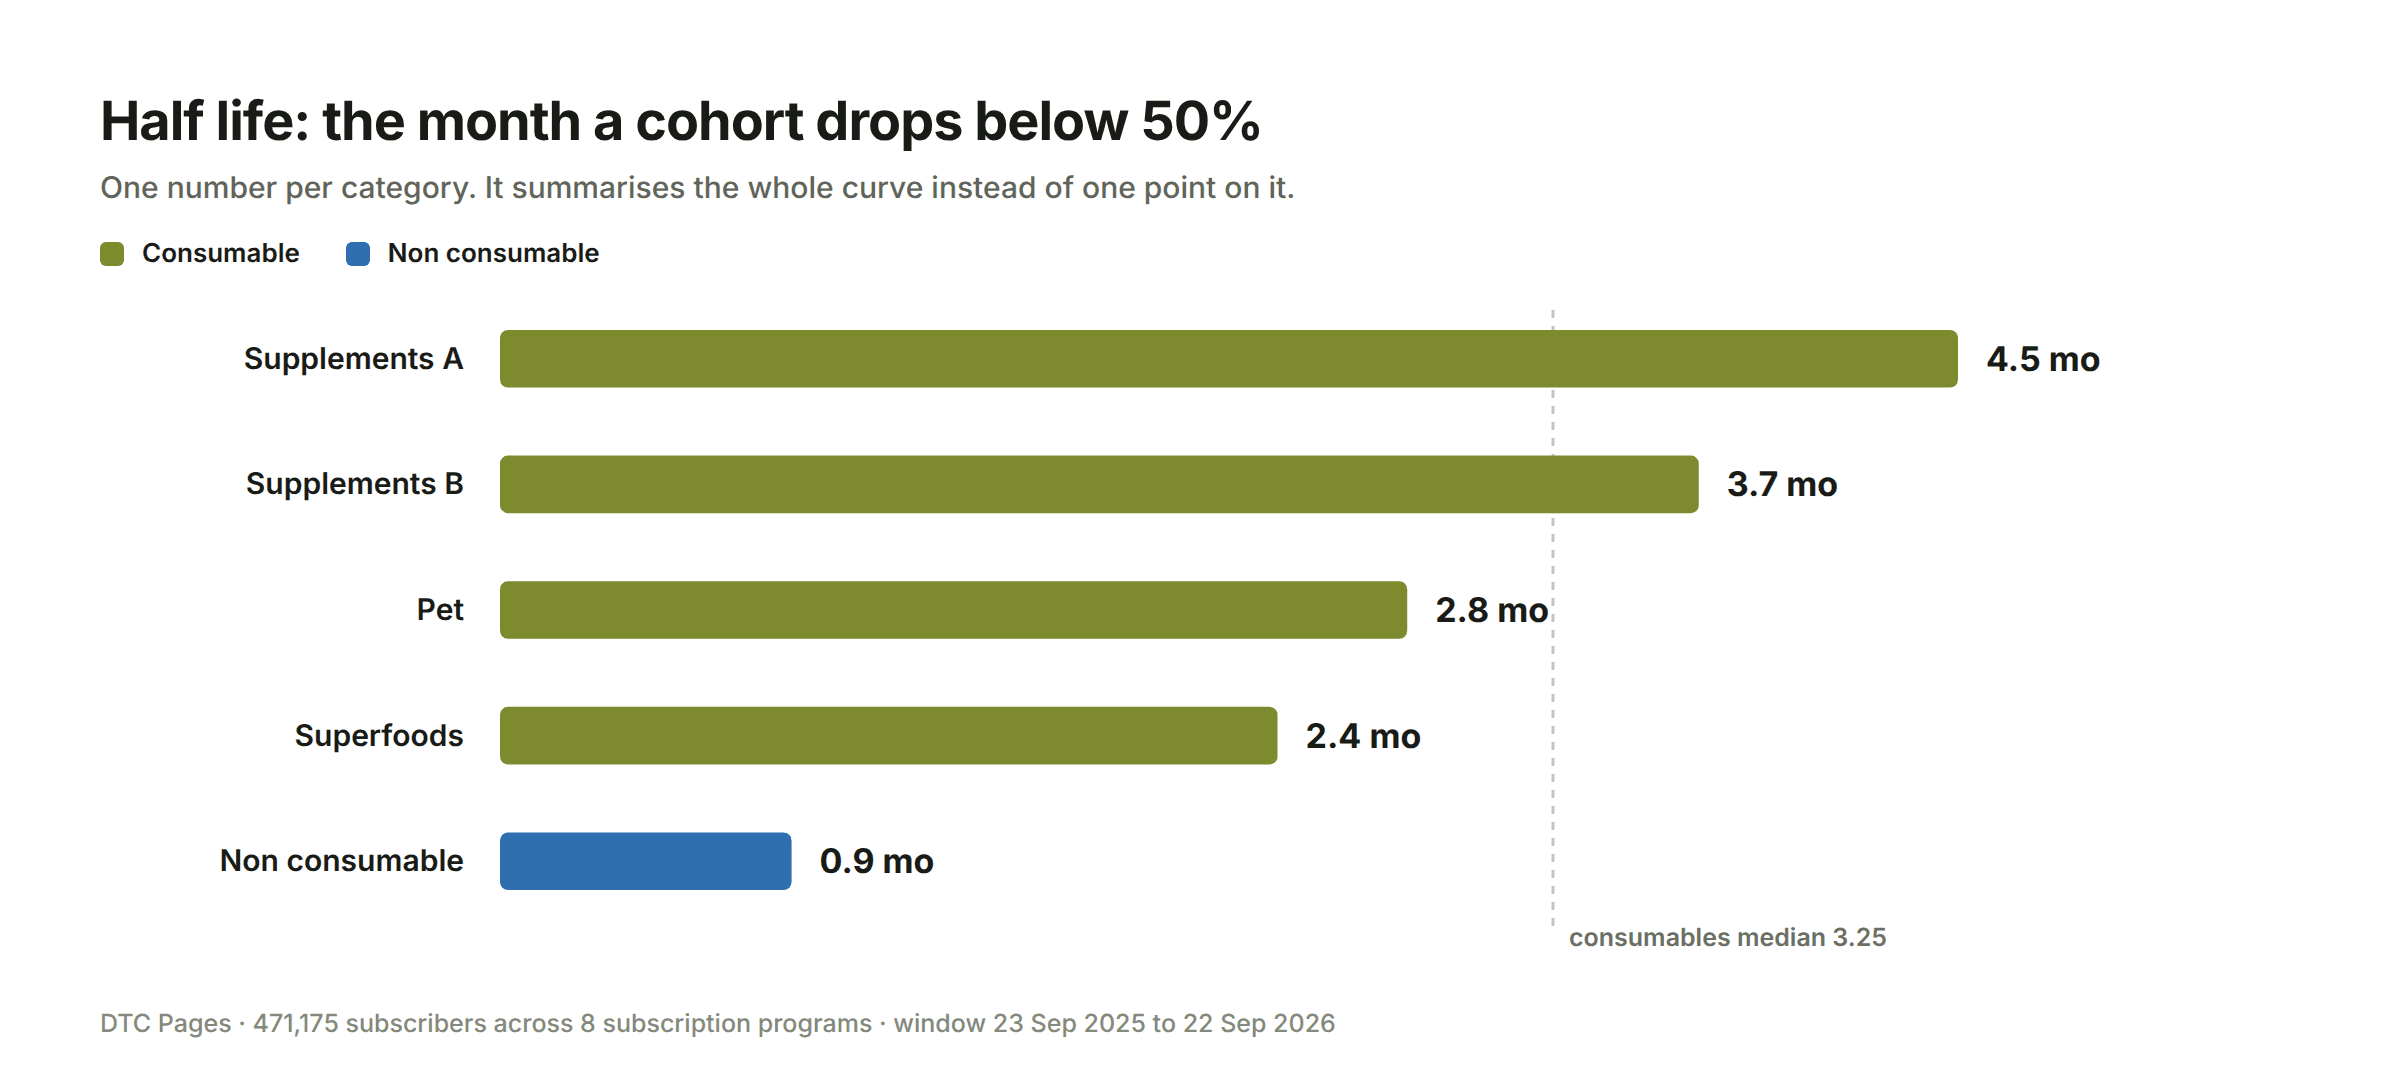
Half life is the month at which half of a signup cohort is gone. You find the two months that straddle 50% and interpolate between them. One of the supplement categories is at 52% in month four and 48% in month five, so its half life is 4.5 months. The non consumable category is at 87% in month zero and 47% in month one, so its half life is 0.9.
| Category | Half life |
|---|---|
| Supplements A | 4.5 months |
| Supplements B | 3.7 months |
| Pet | 2.8 months |
| Superfoods | 2.4 months |
| Non consumable | 0.9 months |
Consumables median 3.25 months, range 2.4 to 4.5. Half lives calculated by DTC Pages from cohort curves covering 471,175 subscribers.
You can calculate yours from any cohort report in about five minutes, and it summarises the whole curve instead of one point on it. That matters more than it sounds. Pick a single month and the order changes under you: the pet category is the best of the four consumable categories at month one and the worst of them by month four, and the two supplement categories trade places between month two and month three.
Unlike a churn rate, half life does not change meaning when your growth rate changes. It follows a closed group, so it does not matter how many people signed up afterwards. It is the only figure in this post we would compare across two stores without checking anything else first.
One warning about reading the table. The category with the best half life is not the one that retains hardest, it is the one that bills least often. There, cadence comes from bundle size, roughly 24 days per unit and up to 96 days on the largest plan. A subscriber on the largest plan barely has an occasion to cancel in the first month. That is product design, not retention work.
Every store loses people at a different month#
A retention curve tells you how many you lost. The drop from one month to the next tells you when. When is the part you can do something about.
| Category | M0 to M1 | M1 to M2 | M2 to M3 | M3 to M4 |
|---|---|---|---|---|
| Supplements A | 17 pts | 12 pts | 9 pts | 4 pts |
| Supplements B | 14 pts | 12 pts | 11 pts | 7 pts |
| Pet | 7 pts | 27 pts | 12 pts | 12 pts |
| Superfoods | 17 pts | 15 pts | 8 pts | 7 pts |
| Non consumable | 40 pts | 23 pts | 10 pts | 4 pts |
Month over month drops across 5 categories measured by DTC Pages, 2026.
Non consumable subscriptions lose 40 points between month 0 and month 1. Almost half of those signups never take a second delivery. That is not a retention problem, it is a purchase expectation problem, and it gets solved before checkout rather than after.
Pet barely loses anyone at that first step, 7 points, then drops 27 at the next one. It shows up in every cohort we have for that category, so it is not one odd month.
One supplements category spreads its losses evenly, 14 then 12 then 11. There is no moment. That is fatigue, and it is the hardest of these to attack for exactly that reason.
The other supplements category ties superfoods for the largest first step drop among the consumables, 17 points, and still finishes with the best curve in the set. First month losses do not predict where a cohort lands.
Two of these five shapes may be the same problem arriving at different moments. When a shipment lasts longer than the billing interval, subscribers accumulate product they have not used, and they cancel once the pile becomes obvious. How long that takes depends on how much product the first box carries. A first box holding twice the interval pushes the drop to the second renewal instead of the first.
Five categories, and one retention benchmark would have described none of them.
Churn is almost never a payment problem#
There is a great deal of content about dunning, card updaters and payment recovery. It is worth doing. It is not where your subscribers are going.
| Category | Voluntary | Passive | Churn events, 12 months |
|---|---|---|---|
| Superfoods A | 93.8% | 6.2% | ~4,000 |
| Supplements | 90.7% | 9.3% | ~49,000 |
| Superfoods B | 87.2% | 12.8% | ~400 |
| Non consumable | 84.4% | 15.6% | ~32,000 |
12 months of churn events from 4 DTC subscription programs measured by DTC Pages, 2026.
Across four programs where the platform separates the two, voluntary cancellations are 84% to 94% of all churn, median 89%. Failed payments are everything else.
We use twelve months of churn events for this split rather than a thirty day window. The counts are an order of magnitude larger, and the split barely moves across four very different programs. That is what you see when something is a real property of the category rather than noise.
Recharge publishes vertical medians for Health and Wellness that point the same way: 7.3% active monthly churn against 0.5% passive.
Four programs, not eight. Two of the platforms in our set do not separate voluntary from passive at all.
Subscription AOV is lower, until subscription becomes the default#
In four of the five categories where we have both numbers, subscription orders are worth less than one time orders. The gap runs from 6% to 24.5%, median 15%.
| Category | Subscription AOV vs one time AOV |
|---|---|
| Supplements A | 48.5% higher |
| Superfoods A | 24.5% lower |
| Supplements B | 19.0% lower |
| Superfoods B | 11.2% lower |
| Non consumable | 6.0% lower |
Subscription against one time AOV in 5 DTC subscription programs measured by DTC Pages, 2026.
That is the subscription discount doing its job. The part worth stating is that subscription trades order value for order count, and plenty of revenue forecasts model it as if average order value holds.
The fifth runs the other way and it is the interesting one. Its subscription orders are worth 48.5% more than its one time orders. Around 98% of its orders are subscriptions, so what is left on the one time side is not an alternative way to buy, it is loose add-ons. Once subscription stops being an option and becomes the way a store sells, the comparison stops describing two paths and starts describing one path plus a bolt-on. That is why the 15% median is taken across the four and not the five.
One more thing belongs here. The share of revenue that comes from subscription tells you nothing about whether the subscription is working. In our set, the non consumable category sits at 72% of revenue and pet at 71%, and they retain 14% and 47% at month three.
Two metrics that look comparable and are not#
Two numbers in your subscription dashboard look like they can be compared against someone else's. Neither can.
Growing fast inflates your churn rate. One category in our set reads 32.1% monthly churn on a thirty day window. Derived from twelve months of churn events, the same category reads 13.6%. If churn were really 32.1% every month, 1% of a cohort would survive the year. Seventeen percent do.
The gap is composition. New subscribers churn faster than old ones, which you can see in any cohort curve. That category added close to five times its active base in new subscribers over the year, so at any given moment almost everyone in the base is new. A thirty day churn rate measures how fast you are growing as much as it measures your subscribers. In a category with an older base, the same two methods read 10.8% and 7.6%.
The twelve month churn rate in your dashboard is not a churn rate. Recharge reports churned subscribers over active base. The numerator counts the whole year and the denominator is today's snapshot, so once your base turns over more than once a year the figure passes 100% by construction. We measured 148.5%, 165.4% and 480.8% across three programs. A rate that reads 480% is not a rate of anything. It is a turnover ratio, and it is sitting in the headline position of the dashboard labelled as churn.
How to read your own curve#
Calculate your half life, not your churn rate. Pull any cohort report and find the month where the cohort drops below 50%. One number, no arguments about denominators, and it does not move when your growth rate moves.
Find your worst month and attack that month. Churn is not one problem. A store losing people at the first renewal has a purchase expectation problem. A store losing them at the fourth has a fatigue problem. The two fixes share nothing.
Divide the days of product in your first shipment by your billing interval. If the answer is greater than one, your subscribers are piling up product they have not used. You can predict the renewal where they notice, and it is earlier than you think.
Check your voluntary split before you invest in dunning. If 89% of your churn is people choosing to leave, a better card updater is working on a fraction of a fraction.
Do not compare your thirty day churn to anyone growing at a different rate. Compare half lives, or compare cohort curves. Those survive the comparison.
The limits of this data#
What this data does not support.
One program holds 67% of the pooled subscribers. We never pool. Every figure here is a median across programs.
Four categories is still a thin consumables band. We publish the full range for that reason.
We dropped the tail of any curve whose cohorts fall under 500 subscribers. Below that a handful of people move the percentage several points.
We dropped two programs entirely for sample size, one under 200 subscribers and one around 1,100.
We dropped one platform from the curve comparison. It forces 100% at month zero and appears to count subscribers with an order that month rather than subscribers still subscribed. That is a different measurement wearing the same label.
One program launched its subscription offering the same month our window opens. Its growth is a launch, not a trend, and we use it for nothing comparative.
The voluntary against passive split comes from four programs, not eight.
Figures are reported by category rather than by store, and nothing here is published at a level that identifies a client.
Frequently Asked Questions#
What is a good subscription retention rate?#
For a consumable DTC product, 45% to 56% of a cohort still active at month three is normal. The DTC Pages median across four such categories is 51%, covering 438,961 subscribers. For a product that does not get consumed the honest answer is that the number is much lower and should not be compared against that band. The non consumable category in our set sits at 14%.
What is a good subscription churn rate?#
There is no single figure, because the churn rate your dashboard shows depends on how fast you are growing. A store adding subscribers quickly reads a much higher rate than a store with the same retention and a stable base. Across the eight programs DTC Pages measures, one category read 32.1% on a thirty day window and 13.6% derived from twelve months of churn events for the same period. Compare half lives or cohort curves instead.
How do I calculate subscription retention?#
Take everyone who subscribed in the same month and treat them as a closed group. Count how many of that exact group are still subscribed one month later, two months later, and so on, and divide by the size of the group. Do not add new subscribers into the count. That is what makes it a cohort curve rather than a churn rate. It is also how DTC Pages calculated every retention figure in this post, across 471,175 subscribers in 8 subscription programs.
Why is my subscription churn rate over 100%?#
Because it is not a churn rate. Most dashboards report churned subscribers over active base, so the numerator counts the whole period and the denominator is today's snapshot. Once your base turns over more than once a year the figure passes 100% by construction. DTC Pages measured 148.5%, 165.4% and 480.8% across three of the eight programs in this set. Read it as a turnover ratio.
What percentage of subscription churn is involuntary?#
Between 6% and 16%, median 11%, across the four DTC Pages programs where the platform separates the two. The other 89% is people choosing to cancel. Recharge's published Health and Wellness medians point the same way: 7.3% active monthly churn against 0.5% passive.
Is subscription AOV lower than one time AOV?#
Usually. In four of the five categories where DTC Pages has both numbers, subscription orders are worth 6% to 24.5% less, median 15%. The exception is a category where around 98% of orders are subscriptions, and there subscription AOV is 48.5% higher, because the one time orders left over are add-ons rather than a real alternative way to buy.
What is subscription half life?#
The month at which half of a signup cohort has cancelled. You find the two months that straddle 50% and interpolate between them. Across the eight programs DTC Pages measures, it runs from 2.4 to 4.5 months for consumable products and 0.9 months for the non consumable one. It is the most comparable single figure we have, because it follows a closed group and does not move when your growth rate moves.
Why does my churn rate go up when I grow?#
Because a thirty day churn rate measures the composition of your base, not the behaviour of your subscribers. New subscribers churn fastest, so a store adding subscribers quickly always has a base made mostly of new subscribers. One of the categories DTC Pages measures reads 32.1% on a thirty day window and 13.6% derived from twelve months, purely because it added close to five times its active base in new subscribers over the year.
What share of orders should include a subscription?#
Recharge publishes a Health and Wellness vertical median of 24% of checkout orders containing a subscription. Be careful comparing that figure across platforms: some report the share of orders containing a subscription and others report subscription revenue over total revenue, and the first always reads higher.
How many months should a subscription cohort be tracked?#
Long enough to pass your half life, and not so long that the cohort gets too small to read. DTC Pages publishes seven months and cuts the tail of any curve whose cohorts fall under 500 subscribers, because below that a handful of people move the percentage several points.
Do non consumable products work as subscriptions?#
They work differently, and they should not be measured against a consumable benchmark. The non consumable category DTC Pages measures retains 14% at month three against a consumable median of 51% across 438,961 subscribers. The product lasts longer than the billing interval, so people cancel and repurchase rather than staying subscribed. That is a cadence mismatch, not a retention failure.
Does Recharge retention compare to Skio retention?#
The curves compare once you line up the definitions, and the labels do not. Recharge calls the signup month Month 0 and Skio calls the same thing 1st Month. Skio also counts subscriptions by default and subscribers behind a toggle, and one person can hold more than one subscription. Check which of the two you are reading before comparing anything. DTC Pages normalised all eight programs to one convention before publishing any of the figures in this post.
How often should I benchmark my subscription program?#
Quarterly is enough for the curve, because a cohort needs months to develop. Check your voluntary against passive split more often than that, since it moves when your payment setup changes.
Want us to run this for your store?
We help 7- to 9-figure Shopify brands increase revenue through data-driven CRO. Book a free strategy call.
Ready to grow your Shopify store?
We help 7- to 9-figure ecommerce brands increase revenue through A/B testing, landing pages, and conversion rate optimization. No contracts, just results.