The "Average" Ecommerce Conversion Rate Is Misleading#
Every benchmarks page you have read probably cites the same number: a global average ecommerce conversion rate somewhere between 2% and 3%. That figure comes from third-party aggregators and industry reports, and it is not wrong. But it is not useful either.
The problem is context. A 2% conversion rate means something very different for a $45 product with high repeat purchase than it does for a $400 considered purchase. Blending those into a single "average" hides more than it reveals.
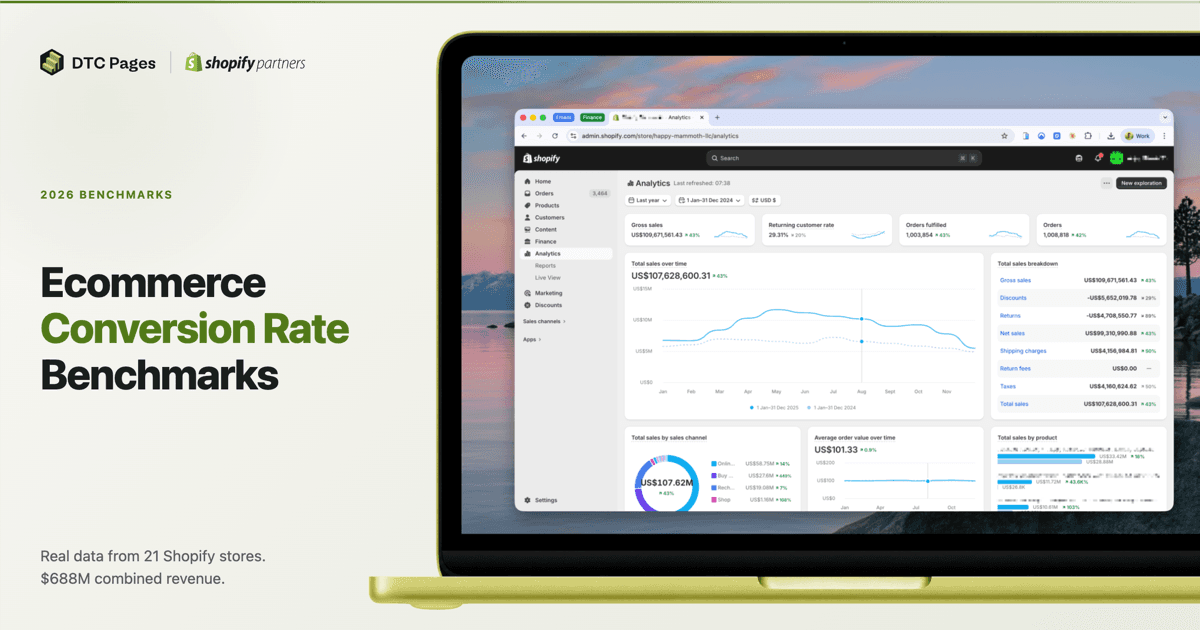
These benchmarks are different. They are based on anonymized first-party data from 21 Shopify stores in our portfolio, generating $688M in combined annual revenue. We are not pulling from surveys or third-party panels. This is real Shopify Analytics data from stores we optimize every day.
As a Shopify CRO agency, we track these metrics daily across every store we manage. Here is what 15 months of data across 161 million sessions actually tells us - broken down by price point, device, funnel stage, revenue tier, and seasonal trends.
Key Benchmarks at a Glance#
Before diving into the breakdowns, here are the headline numbers from our FY2025 dataset. If you only have 30 seconds, this is what you need.
Based on 21 Shopify stores | $688M combined revenue | 161M+ sessions
Overall Conversion Rate (Median)
2.81%
Mean: 2.99% | 75th percentile: 4.40%+
Add-to-Cart Rate
7.23%
Top stores: 10%+
Avg Order Value
$85.44
Median across 21 stores
Mobile CVR
2.87%
84% of all traffic
Desktop CVR
4.51%
57% higher than mobile
Sub-$60 AOV Avg
4.52%
vs 0.97% for $200+
Checkout Drop-off
49.8%
Abandon at checkout
These are the numbers you should compare against - not the generic "2-3%" you find on most benchmarks pages. But even these averages mask huge variation. The real story is in the segments below.
How We Collected This Data#
We selected 21 Shopify stores from our portfolio for this benchmark study and pulled data directly from Shopify Analytics. The dataset covers 15 months: full year 2025 (January through December) plus Q1 2026 (January through March).
The stores span multiple verticals - including health and supplements, home and living, beauty, fashion, food, pet, and more - and range from $1.2M to $110M in annual revenue ($688M combined). All data is fully anonymized.
Conversion rates come from Shopify's sessions table (online store sessions only), not total orders divided by total sessions. We report medians and percentile ranges alongside averages, because averages are heavily skewed by outliers. A single high-volume store at 0.57% CVR can drag the mean down significantly, even when most stores convert above 2%.
21
Shopify Stores
$688M
Combined Annual Revenue
161M+
Sessions Analyzed
Jan 2025 - Mar 2026
Time Period
Spanning health, home, beauty, fashion, food, and more. Updated quarterly.
Conversion Rate Benchmarks by Price Point#
Most benchmark pages organize data by industry. We did too, initially. But after analyzing 21 stores across multiple verticals, we found that average order value is a far stronger predictor of conversion rate than industry alone.
A home decor store selling $43 products converts at nearly 6%. A supplement brand at $101 AOV converts at 2.81%. Both are "successful" stores - but their conversion rates look completely different because price point shapes buying behavior more than product category.
Here is what our data shows when organized by AOV bracket:
21 Shopify stores grouped by price point | FY2025 data
Range
2.75% - 5.92%
Mean CVR
4.52%
Avg ATC
8.58%
Range
1.52% - 4.78%
Mean CVR
3.18%
Avg ATC
8.82%
Range
0.57% - 2.81%
Mean CVR
1.55%
Avg ATC
4.82%
Range
0.71% - 1.26%
Mean CVR
0.97%
Avg ATC
4.99%
Bottom line: Find your AOV bracket above. That is your real benchmark - not the global "2-3%" average. A 1.2% CVR at $200+ AOV is strong performance, not a problem to fix.
The pattern is striking. Stores selling products under $60 had a median CVR of 4.63% - nearly 5x higher than stores above $200 (0.95% median). This is not about good or bad stores. It is about purchase psychology:
- Under $60: Low friction, impulse-friendly. Many of these customers are repeat buyers who already know what they want. The average returning customer rate in this bracket was 51.4%.
- $60 - $100: The widest variance in our dataset (1.52% to 4.78%). Multiple factors drive this range - some stores have strong landing page strategies that pre-qualify traffic before it hits the product page. Others rely heavily on subscription models that lower blended CVR (subscription sign-ups do not count as a conversion in Shopify Analytics). Product-market fit matters here more than anywhere else - brands with a clear audience and strong positioning convert well even at higher price points.
- $100 - $200: The consideration gap kicks in. Shoppers browse multiple sessions before buying. Add-to-cart rates drop sharply to 4.82% (vs 8.58% in the sub-$60 bracket).
- $200+: High-stakes purchases with long research phases. Even well-optimized stores rarely break 1.5%. But higher AOV means each conversion is worth far more in revenue.
What About Industry?#
Industry still matters, but primarily because it correlates with AOV and repeat purchase behavior. Here are the broad patterns we see:
Health, supplements, and beauty brands tend to cluster in the sub-$60 to $80 AOV range. Their products are consumable or replenishable, which drives high returning customer rates and strong conversion. Most of the stores in our top CVR tier sell products in this category. If you are in this space, check our supplement A/B test library and beauty & skincare test library for proven experiments.
Home and lifestyle brands show the widest variance of any category. The range depends almost entirely on price point - a $43 curated decor store behaves nothing like a $224 premium kitchen brand, even though both sell "home" products. Our 50 product page test ideas cover patterns that work across home and lifestyle verticals.
Fashion, footwear, and accessories brands face unique friction from sizing uncertainty, high AOV, and the tactile nature of their products. These brands typically convert between 1% and 1.5%, which is healthy for the category.
Luxury and high-AOV brands (jewelry, premium home goods, specialty items above $200) should benchmark against the 0.7% to 1.3% range. A 1% CVR here is not underperformance - it is the norm for considered purchases.
The takeaway: find your AOV bracket in the table above first. Then look at how your product category's typical purchase behavior (repeat vs one-time, impulse vs considered) compares to others in the same price range.
Conversion Rate Benchmarks by Device#
Mobile drives the overwhelming majority of ecommerce traffic. But it converts at a significantly lower rate than desktop.
Device-level data from 4 stores in our dataset | FY2025
2.87%
4.51%
Why the gap? Desktop visitors have higher purchase intent. They are further along in the buying journey - not browsing casually like most mobile traffic.
Before you rush to "fix" your mobile experience, understand what this gap actually means. Higher desktop CVR does not mean desktop provides a better shopping experience. Correlation is not causation.
The real explanation is purchase intent. Desktop visitors are disproportionately high-intent buyers. They are people who saw a product on their phone, thought about it, and later sat down at their computer specifically to purchase. Or they found the brand through organic search while actively researching. Desktop traffic is self-selected for purchase readiness.
Mobile traffic, on the other hand, is where most discovery happens. Users scrolling Instagram, clicking TikTok ads, browsing casually - this is top-of-funnel behavior. These visitors are earlier in the buying journey. They are browsing, not buying. The lower CVR reflects their intent, not the quality of the mobile experience.
This is a common and costly mistake we see brands make: they look at the mobile-desktop gap and conclude they need to redesign their mobile checkout or replicate the desktop layout on mobile. That rarely moves the needle because the gap is driven by intent, not experience.
The mobile-desktop gap will never fully close because the traffic types are fundamentally different. Instead of chasing desktop-level CVR on mobile, focus on two things: making sure your high-intent mobile visitors can check out frictionlessly (digital wallets, fast page load), and building landing page funnels that warm up cold mobile traffic before asking for the sale.
Benchmarks by Revenue Tier#
This breakdown is unique to our dataset - no other benchmarks page segments by store revenue. Store size has a real effect on conversion rates, and the relationship is not linear.
21 Shopify stores grouped by annual revenue | FY2025 data
Stores
2
Mean CVR
1.39%
Mean AOV
$122.50
Stores
7
Mean CVR
3.61%
Mean AOV
$82.55
Stores
6
Mean CVR
3.39%
Mean AOV
$144.00
Stores
6
Mean CVR
2.39%
Mean AOV
$115.50
Sweet spot: $5M-$15M stores have the highest median CVR (3.54%). Large enough to invest in CRO, but not yet diluted by broad top-of-funnel traffic.
The relationship is not linear - it peaks in the middle and drops at both ends.
Why do $30M+ stores often have lower conversion rates? Three reasons:
- Broader audiences. Larger brands run more top-of-funnel campaigns (brand awareness, influencer, PR) that drive traffic from people who are not yet ready to buy.
- Channel diversification. More traffic sources means more cold traffic, which converts at a lower rate than direct or branded search.
- Catalog expansion. Wider product ranges attract browsers and researchers, not just buyers.
This does not mean large stores are "worse" at conversion. They are simply playing a different game. A $30M+ store with a 2.14% CVR and 13 million sessions generates far more revenue than a $10M store at 3.54%.
If your store is in the $0 to $5M range, the priority should be product-market fit, traffic quality, and building strong landing pages that convert cold traffic into buyers. Once you cross the $5M mark, A/B testing starts to make financial sense because you have enough traffic to reach statistical significance quickly. And paradoxically, the bigger you get, the more valuable testing becomes. More traffic means you reach statistical significance faster, which means you can run more experiments per year. Those wins compound. A brand running 50 tests a year will outpace one running 10 - and high-traffic stores can move at that pace.
The Full Conversion Funnel - From Session to Sale#
Most benchmark pages stop at conversion rate. But CVR alone does not tell you where the problem is. You need to see the full funnel.
Based on FY2025 averages across 21 Shopify stores
The biggest drop happens before add-to-cart. Out of every 100 visitors, roughly 93 leave without adding a single product. Your landing pages and product pages are the number one lever here.
But the 49.8% checkout abandonment rate is equally telling. Nearly half of the people who start checkout do not finish it. That is a massive opportunity for checkout optimization.
Add-to-Cart Rate Is the Leading Indicator#
Across our 21 stores, add-to-cart rate was the strongest predictor of overall conversion:
- Stores with ATC rate above 10% consistently had CVR above 3.8%
- Stores with ATC rate below 5% rarely broke 1.5% CVR
Four stores in our dataset had ATC rates above 10%, and all four converted above 3.8%. What they share is not a single vertical - they span different categories. What they have in common is landing pages and product pages that do the selling: clear benefits, strong imagery, visible pricing, and prominent add-to-cart buttons.
If your add-to-cart rate is below 5%, the problem is almost certainly on your landing pages and product pages - not your checkout. Focus your optimization efforts there first. For 50 specific tests you can run on product pages, check our PDP Test Library.
If your ATC rate is healthy (7%+) but your CVR is still low, look at the ATC-to-checkout and checkout-to-purchase drop-off rates. Common culprits: surprise shipping costs, mandatory account creation, and slow checkout page speed.
Year-over-Year Trends - The Growth vs Conversion Tradeoff#
Benchmarks are a snapshot. Trends tell you where things are heading - and why.
Quarterly totals across all 21 stores. Traffic grew 50% year-over-year while CVR declined 22%.
Q1 2025
Q2 2025
Q3 2025
Q4 2025
Q1 2026
Why this happens: As brands scale acquisition (paid ads, influencer, PR), they bring in colder audiences who are less likely to buy on the first visit. More traffic is a sign of growth, not a conversion problem.
The headline looks alarming: conversion rates dropped 22% comparing Q1 2025 to Q1 2026. But the full picture tells a different story. Total sessions across our 21 stores grew 50% in the same period - from 27.3 million to 41 million per quarter. The brands in our portfolio are scaling.
This is the growth-conversion tradeoff that every scaling brand faces. As stores invest in broader acquisition - paid social, influencer partnerships, PR, top-of-funnel content - they bring in larger audiences who are earlier in the buying journey. These visitors are less likely to convert on their first visit, but they expand the brand's reach and build future demand.
Same-quarter comparison across all 21 stores (removes seasonality bias)
Q1 2025
2.99%
Q1 2026
2.32%
Q1 2025
$112.37
Q1 2026
$114.70
Q1 2025
7.16%
Q1 2026
5.85%
Q1 2025
5.88%
Q1 2026
4.67%
Q1 2025
66.45%
Q1 2026
70.43%
Why Q1 vs Q1? Comparing the same quarter year-over-year removes seasonal effects. The 22% CVR drop is a real trend, not a seasonal artifact.
Looking at the funnel data Q1 to Q1, the pattern is clear:
- More visitors, less intent. Bounce rates climbed from 66.45% to 70.43%. The new traffic includes more browsers and researchers, not just ready-to-buy shoppers.
- Landing page engagement dropped. Add-to-cart rates fell 18.3% - the biggest signal that incoming traffic is colder and less purchase-ready.
- But buyers are spending more. AOV ticked up 2.1% ($112.37 to $114.70). The people who do convert are spending slightly more per order. Quality of buyer is stable - there are just fewer converters per session.
The stores that grew traffic the most saw the steepest CVR declines. In our dataset, there is a moderate negative correlation (r = -0.46) between session growth and CVR change. One store that 4x'd their Q1 traffic saw CVR drop from 7.6% to 2.2%. Another cut traffic 60% and watched CVR more than double.
This does not mean you should avoid growing traffic. It means you should expect CVR to dip when you scale acquisition and benchmark against your growth trajectory, not a static target.
The quarterly breakdown from 2025 shows the seasonal pattern. CVR peaked in Q2 (3.21%) when stores ran targeted campaigns, then dipped through Q3 and Q4 as broader holiday traffic kicked in. November saw a BFCM spike, but the conversion lift was driven by promotions, not traffic quality.
Average across all 21 stores per quarter
AOV
$112.37
ATC Rate
7.16%
Bounce
66.45%
AOV
$111.31
ATC Rate
7.85%
Bounce
65.10%
AOV
$114.86
ATC Rate
6.89%
Bounce
67.81%
AOV
$114.77
ATC Rate
7.02%
Bounce
68.29%
AOV
$114.70
ATC Rate
5.85%
Bounce
70.43%
Peak: Q2 2025 (3.21%) | Low: Q1 2026 (2.32%). Q2 consistently outperforms Q4, despite BFCM driving November volume.
Average CVR across 21 stores, January 2025 - March 2026
We will update this data with Q2 2026 numbers in July. Bookmark this page and check back.
What Makes Top-Performing Stores Different#
Looking at stores in the 75th percentile and above (CVR of 4.40%+), several patterns emerge that separate them from average performers.
1. They Sell at Lower Price Points#
Every store converting above 4% in our dataset had an average order value under $80. Lower price points reduce purchase friction and enable impulse buying. But this also means high-AOV stores should not benchmark against these numbers. If you sell $200+ products and convert at 1.2%, you may already be outperforming your peers.
2. They Have Strong Landing Pages and Product Pages#
The four stores with add-to-cart rates above 10% all converted above 3.8%. They span different product categories, but they all invest heavily in their landing page strategy and product page experience - clear benefit statements, high-quality imagery, visible pricing, and prominent add-to-cart buttons. A high ATC rate means your pages are converting browsers into potential buyers, regardless of what you sell.
3. They Invest in Systematic Testing#
Every top-performing store in our dataset runs an active A/B testing program. They do not guess what works - they test systematically and compound small wins over time.
4. They Optimize Checkout Aggressively#
Digital wallets, one-page checkout, minimal form fields. The stores with the lowest checkout abandonment rates all had Shop Pay and Apple Pay enabled, and used Shopify's optimized checkout flow rather than custom solutions.
5. Most (But Not All) Have Strong Customer Retention#
Stores with 50%+ returning customer rates averaged 4.06% CVR - nearly double the average of stores below 50%. But the exceptions are notable. Some stores thrive on acquisition alone, converting at 3.5%+ with fewer than 15% returning customers. The lesson is that product-market fit and well-targeted traffic can produce high CVR even without a large base of repeat buyers.
One brand in our dataset improved CVR by 49% through systematic A/B testing over 12 months. See the FlutterHabit case study for the full breakdown, or browse all our case studies to see how we approach CRO across different verticals.
How to Benchmark Your Own Shopify Store#
Knowing the averages is only useful if you can compare your own store properly. Here is a four-step process.
Step 1: Segment Your Data#
Never look at your blended conversion rate alone. Break it down by:
- Device (mobile vs desktop)
- Traffic source (organic, paid, email, social, direct)
- Customer type (new vs returning)
- Product category (if you sell across multiple categories)
Your blended CVR is the average of these very different audiences. A 2% blended rate could mean 4% from email and 0.8% from paid social - two completely different problems requiring completely different solutions.
Step 2: Compare Against Your Price Point#
Use the AOV bracket table above to find your tier. If your average order is $45, your benchmark range is 2.75% to 5.92%, not the generic 2.5%. If you sell products at $200+, anything above 1% is solid performance.
Then consider your product type. Consumable products with high repeat purchase rates naturally convert higher than one-time considered purchases, even at similar price points.
Step 3: Identify Your Biggest Gap#
Look at your funnel metrics. Where is the biggest percentage drop-off?
- Low ATC rate (below 5%)? Your landing pages and product pages need work.
- High ATC but low checkout rate? Cart page friction or surprise costs.
- High checkout starts but low completion? Checkout UX or trust issues.
Step 4: Set Quarterly Improvement Targets#
Aim for incremental improvement, not dramatic jumps. A 10-15% relative improvement per quarter is excellent. Going from 2.5% to 2.85% CVR might sound small, but on 100K monthly sessions, that is 350 additional orders.
Use our statistical significance calculator to make sure your improvements are real and not just noise. And if you want a professional assessment of where your store stands, a CRO audit can identify the highest-impact opportunities in your specific funnel.
Want us to run this for your store?
We help 7- to 9-figure Shopify brands increase revenue through data-driven CRO. Book a free strategy call.
Frequently Asked Questions#
What is a good ecommerce conversion rate in 2026?#
Based on our data from 21 Shopify stores, the median conversion rate in FY2025 was 2.81% and the mean was 2.99%. Stores in the 75th percentile converted at 4.40% or higher. A "good" rate depends heavily on your average order value - stores selling products under $60 had a median CVR of 4.63% while stores above $200 had a median of 0.95%.
What is the average Shopify conversion rate?#
Across our dataset of 21 Shopify stores generating $688M in combined revenue, the mean conversion rate was 2.99% and the median was 2.81% for FY2025. Q1 2026 showed a dip to a 2.32% mean and 2.17% median, driven primarily by traffic growth (sessions grew 50% year-over-year). These figures represent active, well-managed stores - the broader Shopify average including inactive stores is lower.
What is a good mobile ecommerce conversion rate?#
Our data shows mobile converts at 2.87% on average, compared to 4.51% for desktop. Mobile accounts for 84.4% of all ecommerce traffic. However, the gap is primarily driven by purchase intent - desktop visitors tend to arrive with higher buying intent, not because the desktop experience is inherently better. A mobile CVR above 3% is strong, and above 4% is excellent.
What is a good add-to-cart rate?#
The average add-to-cart rate across our 21 stores was 7.23% for FY2025. Stores with ATC rates above 10% consistently had overall conversion rates above 3.8%. If your ATC rate is below 5%, your landing pages and product pages are likely the bottleneck, not your checkout.
How do you calculate ecommerce conversion rate?#
Ecommerce conversion rate equals total orders divided by total sessions, multiplied by 100. In Shopify Analytics, this is calculated from the sessions table (online store sessions only). Important: use sessions, not unique visitors, as the denominator - this is the industry standard and what Shopify reports natively.
What is a good conversion rate by industry?#
Industry matters less than most people think. In our data, average order value is the strongest predictor of conversion rate. Stores selling products under $60 had a median CVR of 4.63% regardless of vertical, while stores above $200 had a median of 0.95%. Within a given price range, consumable products with high repeat purchase rates tend to convert higher than one-time considered purchases. Rather than benchmarking by industry alone, start with your AOV bracket and adjust for your product type.
How can I improve my store's conversion rate?#
Start by identifying where your funnel leaks. If your add-to-cart rate is below 5%, focus on your landing pages and product pages (better images, clearer benefits, social proof, sticky ATC buttons). If checkout abandonment is high, enable digital wallets, show shipping costs early, and reduce form fields. For systematic improvement, consider an A/B testing program - one of our clients improved CVR by 49% through structured testing.
Why is my Shopify conversion rate dropping?#
A declining conversion rate does not always mean your store is getting worse. In our data, the most common cause is traffic growth. When stores scale acquisition through paid social, influencer partnerships, or broader campaigns, they bring in colder audiences with lower purchase intent. Sessions across our 21 stores grew 50% year-over-year while CVR dropped 22% - not because the stores got worse, but because the traffic mix shifted toward earlier-stage buyers.
What is a good checkout abandonment rate?#
In our dataset, 49.8% of shoppers who started checkout did not complete their purchase. This means roughly half of all checkout sessions end without an order. A checkout abandonment rate below 45% is strong. The most effective fixes are enabling digital wallets (Shop Pay, Apple Pay), showing shipping costs before checkout, and minimizing form fields.
Does higher traffic lower conversion rate?#
Yes. There is a moderate negative correlation (r = -0.46) between traffic growth and conversion rate change in our data. Stores that grew sessions the most saw the steepest CVR declines. This is expected - scaling acquisition brings in colder, less purchase-ready visitors. One store that 4x'd their quarterly traffic saw CVR drop from 7.6% to 2.2%. This is a sign of growth, not a conversion problem.
What is AOV and why does it matter for conversion rate?#
AOV (average order value) is the average amount a customer spends per order. In our data, AOV is the strongest predictor of conversion rate - stronger than industry, traffic source, or store size. Stores with AOV under $60 had a median CVR of 4.63%, while stores above $200 had a median of just 0.95%. Lower-priced products have less purchase friction, enabling more impulse buying and repeat purchases.
How often should I benchmark my conversion rate?#
Review your conversion metrics at least quarterly. Monthly monitoring catches seasonal trends and campaign impacts. We update these benchmarks every quarter with fresh data, so bookmark this page and check back for the latest numbers.
Get a Professional Assessment#
Want to know exactly where your store stands relative to these benchmarks? We offer a free strategy call where we will review your analytics, identify your biggest conversion gaps, and show you where the opportunities are.
No contracts. No obligation. Just data-driven insights from a team that manages $688M in ecommerce revenue.
Ready to grow your Shopify store?
We help 7- to 9-figure ecommerce brands increase revenue through A/B testing, landing pages, and conversion rate optimization. No contracts, just results.